Below are two options to determine if the App Visibility Portal and/or App Visibility Collector is the Active or Standby node:
Option 1
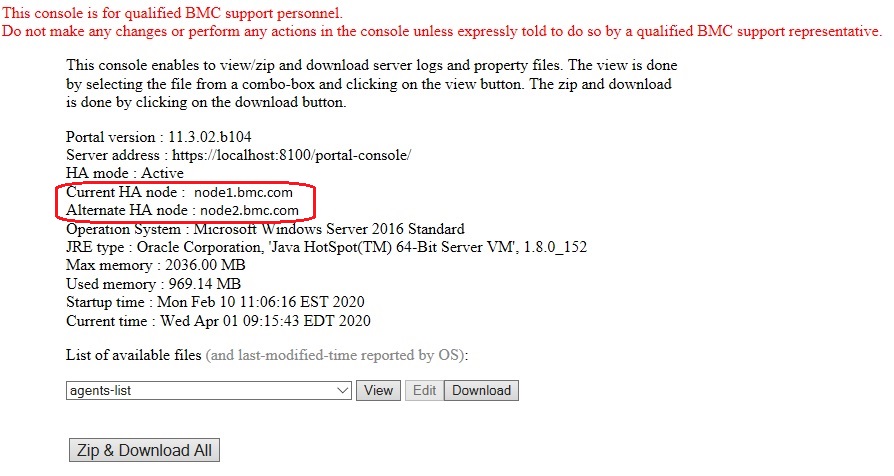
Log into the App Visibility Portal console or App Visibility Collector console using the load balancer's URL and port. On the main web page, look for the 'Current HA node' field, which will display the Active node, and the 'Alternate HA node' field, which will display the Standby node. See the screen shot below for an example:
Option 2
On the server with the App Visibility Portal or App Visibility Collector, go to the logs directory. Open the log file called portal.log for the App Visibility Portal or collector.log for the App Visibility Collector, and search for the following words:
Setting high-availability mode to
Look for the latest date and time stamp, and it will either state [HA_ACTIVE] or [HA_STANDBY] at the end of the line. See below for examples of the messages in the log:
Oct-15-2017 06:58:49 CDT [HA] [Thread-0] [INFO] - Updated HA nodes. Current nodes: [abc1].
Oct-15-2017 06:58:51 CDT [PGSQL_HA] [Thread-0] [INFO] - Configured databaseserver as [HA_ACTIVE]
Oct-15-2017 06:58:51 CDT [HA] [Thread-0] [INFO] - Setting high-availability mode to [HA_ACTIVE]
---------------
Mar-27-2018 10:06:06 EDT [HA] [Thread-0] [INFO] - Updated HA nodes. Current nodes: [abc1, abc2].
Mar-27-2018 10:06:37 EDT [PGSQL_HA] [Thread-0] [INFO] - Starting to copy primary node data dir
Mar-27-2018 10:06:43 EDT [PGSQL_HA] [Thread-0] [INFO] - Primary node data dir copied successfully
Mar-27-2018 10:06:49 EDT [PGSQL_HA] [Thread-0] [INFO] - Configured database server as [HA_STANDBY]
Mar-27-2018 10:06:49 EDT [HA] [Thread-0] [INFO] - Setting high-availability mode to [HA_STANDBY]
